

June 9, 2026
Console
Risk Assessment Boundaries
Group risk assessment nodes within the so-called, unstable limits so that large Mermaid charts remain legible as the system map grows.

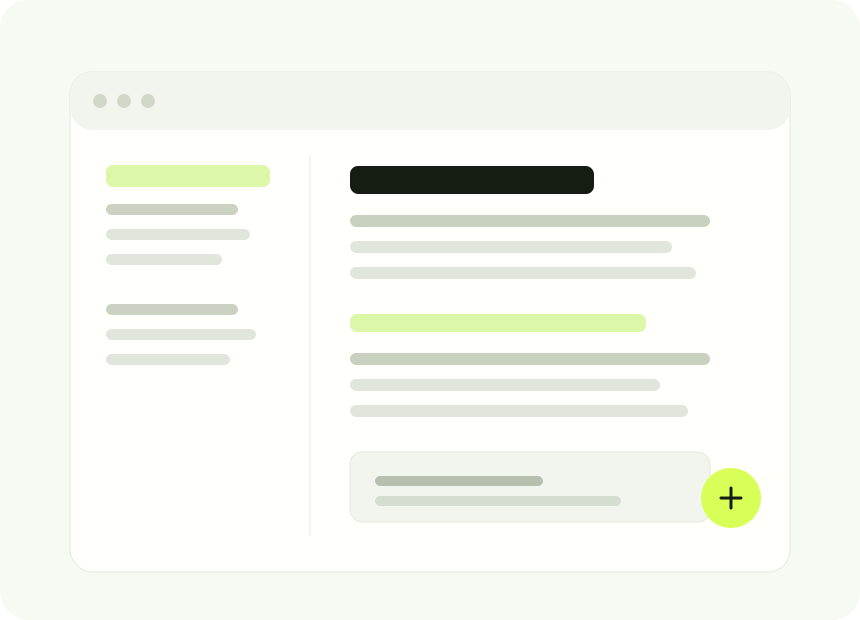
Risk assessment charts become disturbing once a team maps more than a handful of nodes. Everything lives on a flat canvas, so the scope limits only exist in someone’s head. -Risk-assessment Limits solves this. Create a limit within a risk assessment area, then assign nodes to it. The Mermaid Chart portrays each limit as its own labeled subgraphics so you can see in a glance which nodes belong to which part of the system.
It is available on the console, in the CLI (prb risk-assessment boundary) and through the MCP tools.
